A science-based tool to assess and act on your organisation’s biodiversity footprint

The Global Biodiversity Score (GBS), developed by CDC Biodiversité, is a robust, streamlined tool designed to quantify your organisation’s impact and dependency on biodiversity across the entire value chain.

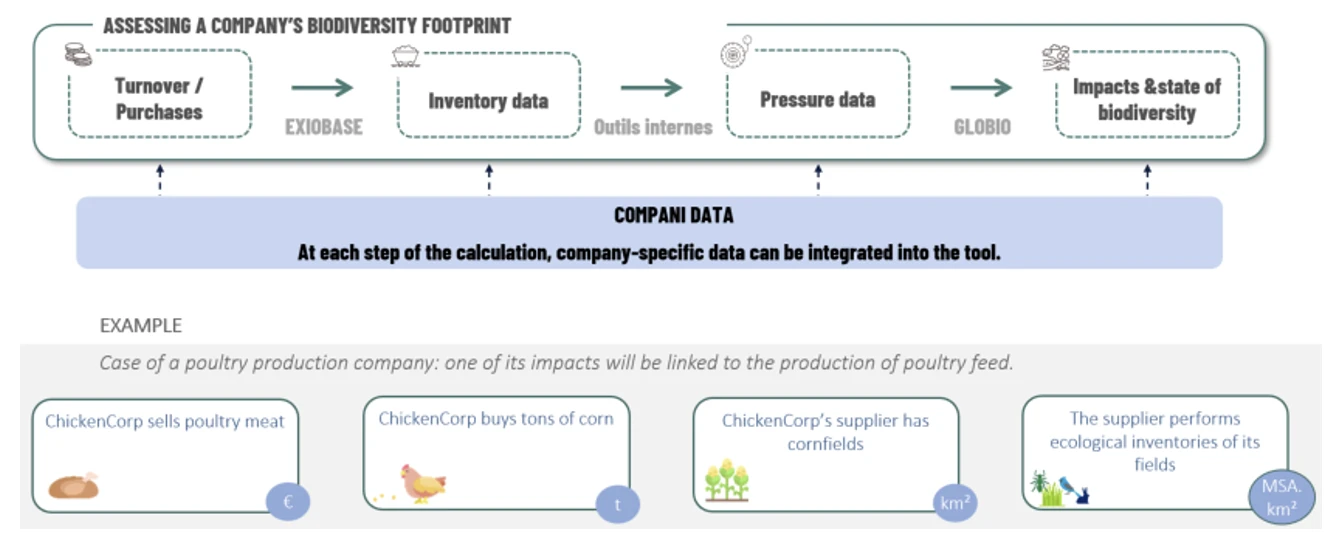
It works directly from your company’s data, whether financial data, inventory data, or environmental pressure data, and combines several scientific models (including GLOBIO and EXIOBASE) to translate complex inputs into a single, actionable impact metric: MSA.km².

This approach ensures that decision-makers can rely on their own data to measure biodiversity impacts, understand dependencies, define goals, targets and trajectories aligned with the Kunming-Montreal Global Biodiversity Framework and align strategies with frameworks such as TNFD, CSRD, etc.

The MSA metric

Mean Species Abundance (MSA) is a scientific metric that measures the average abundance of species in an ecosystem compared to its natural state (undisturbed habitat = 100%).

  • Simple yet robust: one number to summarise biodiversity intactness.
  • Science-based: widely used in ecological modelling and policy frameworks.
  • Action-oriented: expressed in MSA·km², it shows the scale of biodiversity loss or gain linked to human activities. For example, an impact of 1 MSA.km² is equivalent to the destruction of 1 km² of undisturbed natural ecosystem.

This metric makes it possible to compare impacts across sectors, geographies, and pressures, and to track progress over time.

Why use the GBS?
Comprehensive footprint

Measure biodiversity impacts and dependencies across your entire value chain – Scope 1, 2, and 3.

Science-driven, continuously evolving & transparent

Built on recognised peer-reviewed models (GLOBIO, EXIOBASE), continuously evolving to align with scientific progress, with an open-source version to promote innovation.

Easy to use platform

Designed for ease of use, upload your data and generate results, no installation needed. Benefit from dynamic visualisations, multi-format outputs, easily exportable Excel files, and a complete history of your runs.

Multi-stakeholder ecosystem

Developed collaboratively with businesses, financial institutions, NGOs, and public authorities through the B4B+ Club.

Alignment with global frameworks

Ensure consistency with leading sustainability frameworks such as CSRD, TNFD, SBTN, GRI, and the Global Biodiversity Framework (GBF), making reporting and target-setting credible.

How does the GBS work?
Measurement approach

Links your economic activity to biodiversity pressures and converts them into impacts expressed in a single metric (MSA.km²).

Modular & adaptable

From corporate assessments to financial portfolios and territorial applications, the GBS adapts to different user needs.

Actionable outcomes

Inform impact reduction targets and trajectories, monitor progress, and align with global biodiversity and reporting frameworks.

The biodiversity footprint measurement process
Four key steps to measuring your biodiversity footprint with the GBS

Define the scope of the assessment:

  • Organisational perimeter | Which entities, sites, and activities are included?
  • Temporal perimeter | What year is covered?
  • Geographical perimeter | Where are operations and value chain activities located?
  • Value chain perimeter | Which operations are direct and which are upstream / downstream?

Build a materiality matrix:

  • Identify expected material impacts.
  • Identify sector-specific dependencies.

Identify key stakeholders and available resources (e.g., GHG assessments, sustainability reports).

Develop a project timeline.

  • Collect data from internal and external contacts; perform a data diagnosis.
  • For missing data, identify alternatives or propose modelling hypotheses.
  • Build impact factors tailored to your needs.
  • Easily upload your activity data on the platform.
  • The GBS calculates cumulative and periodic footprints by business unit, pressure, and scope.
  • Conduct a consistency check on results.
  • Identify key findings: biodiversity risks, opportunities, and levers for action.
  • Co-create the final report with an action plan for your direct operations and value chain, including timelines and measurable targets.
Key milestones & Impact
  • null

    2015

    First developments of the Global Biodiversity Score (GBS) methodology.

  • null

    2016

    Launch of the B4B+ Club to co-develop the tool with companies, financial institutions, and consultancies.

  • null

    2020

    GBS 1.0 launch.

    First Biodiversity Footprint Assessment (BFA) carried out with Schneider Electric

  • null

    2021

    Launch of the Finance module (BIA-GBS) for listed assets.

  • null

    2024

    GBS Open – Open-source release of the methodology.

  • null

    2025

    Launch of the GBS SaaS platform.

  • null

    Today

    +200 organisations are using the GBS worldwide

Ready to get started?

Join companies, financial institutions, and public authorities in measuring biodiversity impact with confidence.

Explore our latest update on the Global Biodiversity Score

Dive into insights, methodology refinements, and case studies.

Download the publication